Prometheus/Grafana Setup
Objective#
The objective of this project is to set up Prometheus and Grafana, install the Prometheus agent on an EC2 instance, and configure an alert in Grafana based on metrics collected by Prometheus.
Prerequisites:
- AWS account with administrative access
- EC2 instance(s) running in your AWS account.
IAM Policy#
Step 1: Set up Prometheus and Grafana#
- Launch an EC2 instance or use an existing one to set up Prometheus and Grafana. Ensure that the instance has inbound rules allowing traffic on ports 9090 (Prometheus) and 3000 (Grafana).
- Connect to the EC2 instance using SSH.
- Update the package repository and install necessary dependencies:
- Access Grafana using your browser by visiting
http://<EC2-Instance-IP>:3000. Login using the default credentials (username: admin, password: admin) and change the password when prompted.
Step 2: Configure Alert in Grafana#
- Open Grafana in your browser and log in using your credentials.
- Click on the "Configuration" icon in the left sidebar, then select "Data Sources".
- Click on "Add data source" and select "Prometheus" as the data source type.
- Configure the Prometheus data source with the following details:
- Name: Prometheus
- URL:
http://<EC2-Instance-IP>:9090 - Access: Server
- Click on "Save & Test" to validate the data source.
- Return to the Grafana home dashboard and click on the "+" icon to create a new dashboard.
- Click on "Add Query" and select the Prometheus data source you configured earlier.
- Enter the desired Prometheus query to fetch the metric you want to set an alert on (e.g.,
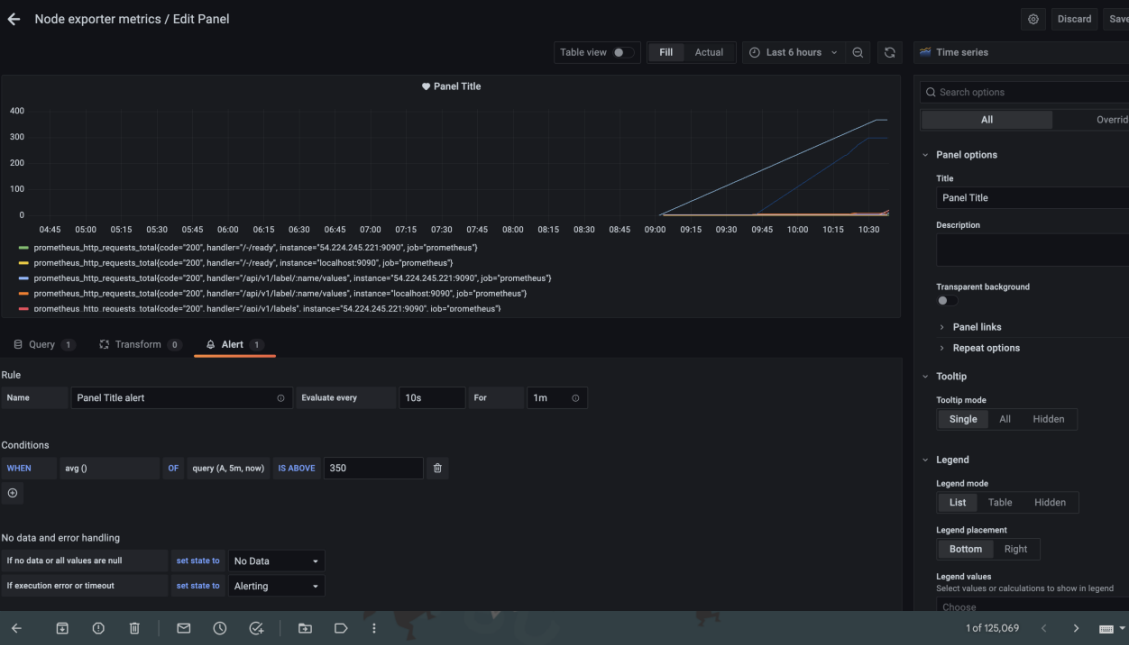
node CPU{instance="<EC2-Instance-IP>:9100", mode="idle"}). - Set the desired alert condition and configure the notification channels (e.g., email, Slack, etc.).
- Save the dashboard and enable the alert by toggling the "Alerting" switch.
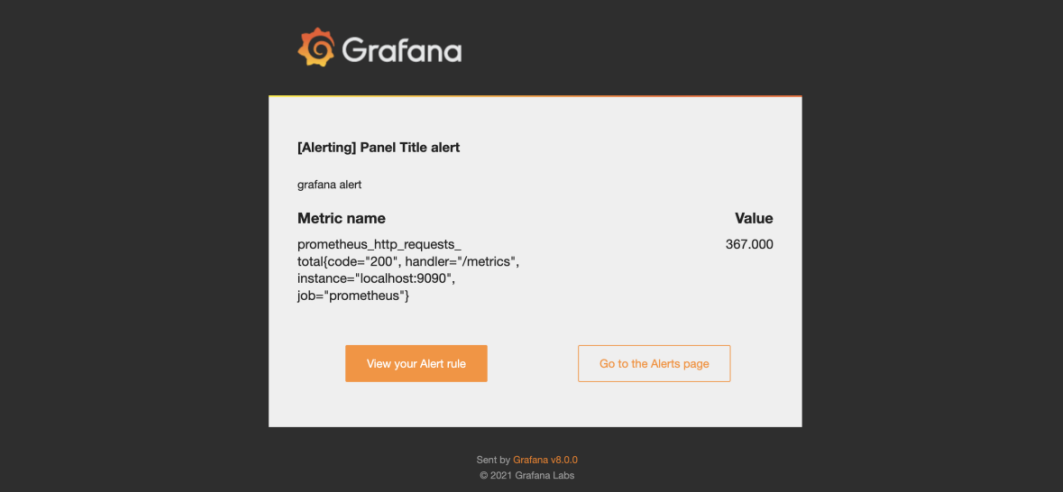
- Test the alert by triggering the condition and ensuring that the notification is sent to the configured channels.
Results#
Grafana Metrics#

Mail Alert#
